AirTags have a couple of drawbacks…
My excitement for Apple’s AirTags was summarily crushed upon realizing AirTags are not Android-compatible. While there are AirTag equivalents for non-iphones such as Tile, they don’t work nearly as well. There’s a simple reason for this.
Trackers like AirTags and Tiles work by pinging nearby smartphones over Bluetooth. These phones then send their location data to Apple’s and Tile’s respective servers, which in turn make this location data available to the owner of the tracker. Thus, as long as a participating phone is physically near the tracker, the tracker’s owner can infer the location of the tracker from the location of the nearby phone. AirTags work so well because everyone with an iPhone is forced to participate in this system. Thus, an iPhone will almost always be near your AirTag, so you can almost always know your AirTag’s location.
In contrast, the only participating phones in Tile’s similar network are those of other Tile owners. This network is much smaller: In the entire Santa Barbara area, there are only about 1,500 Tile owners.
So I did what any reasonable, self-respecting, and normal person would do in my situation: I set out to design and build my own location tracker that will work with Android phones, avoid Tile’s mistakes, and be cleverly named. Join me on this adventure to create PearTags!
PearTags Will Use Wi-Fi Signals
Unlike AirTags, my tracker will not have a large network of GPS enabled iPhones to rely on for location measurements. Instead, PearTags will have to take their own measurements with their own sensors and calculate their locations using their own processors. From my literature review, there are three main options for measurements that PearTags could make while maintaining a small form factor tracker and without unusual requirements such as nearby routers with 8+ antennas and/or routers that implement the IEEE 802.11mc standard:
- Satellite GPS data
- Cell tower signal strengths
- Wi-Fi router signal strengths
While GPS can be fairly accurate in outdoor locations, it wouldn’t work well for PearTags. In indoor locations, GPS devices can’t connect to as many GPS satellites as they can outdoors, greatly reducing their accuracy indoors.
I also looked into using cell tower data because cell signal functions consistently in most outdoor and indoor locations. By measuring the strength of a cell signal from a particular tower, one can measure the distance from that tower. Repeat that process with three different cell towers, and you get three circles whose intersection reveals the tracker’s location. This is known as “triangulation,” or “cell signal triangulation” in this case.
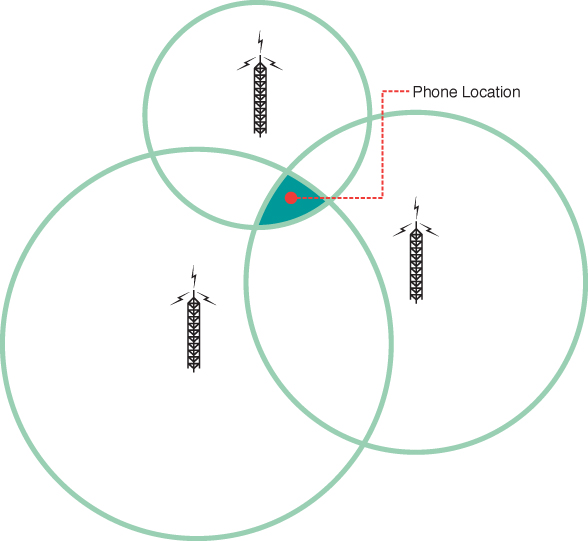
Image courtesy of O’Reily, source
Unfortunately, this method tends to have an accuracy in the order of several dozen yards. This might help me find which building I left my jacket in, but nothing more accurate than that.
Finally, PearTags could measure Wi-Fi signal strengths. Unfortunately, Wi-Fi signals use a lower wavelength than cell signals, which means that physical objects like walls significantly weaken and reflect Wi-Fi signals. This leads to inaccurate distance measurements from the device to the router. Using triangulation with these distance measurements leads to an accuracy as poor as 15 feet [1].
A strategy known as Wi-Fi fingerprinting overcomes this obstacle by not considering distance in the first place. With Wi-Fi fingerprinting, “fingerprints” of Wi-Fi signal strengths (aka, RSSIs or Received Signal Strength Intensity) are recorded onto a map. When a device wants to find its current location, it measures its Wifi “fingerprint” (ie the RSSIs of nearby routers) and compares them to a map of previously collected “fingerprints.” The fingerprint on the apriori map that is closest to the current fingerprint is assumed to be the device’s location. Fancier Wi-Fi algorithms can get more precise location estimates by interpolating between nearby fingerprints. The best Wi-Fi fingerprinting implementation can achieve a minimum accuracy of about 4 feet and functions well indoors [1], which is why I ultimately decided to use it for PearTags.
A simple sanity check
Before collecting tons of data, thinking about fancy algorithms, and writing tons of code, I figured I should start small. I’d first explore and implement Wi-Fi fingerprinting in a simple and small context, just in my house. This way, I can identify simple problems more easily without distracting myself with the more complicated challenges associated with larger areas.
First, I wanted to know if there are in fact distinguishable differences between a Wi-Fi
fingerprint in my kitchen, living room, and dining room. After all, models can only differentiate between things
that are in fact different! Behold this masterfully crafted map portraying these areas:
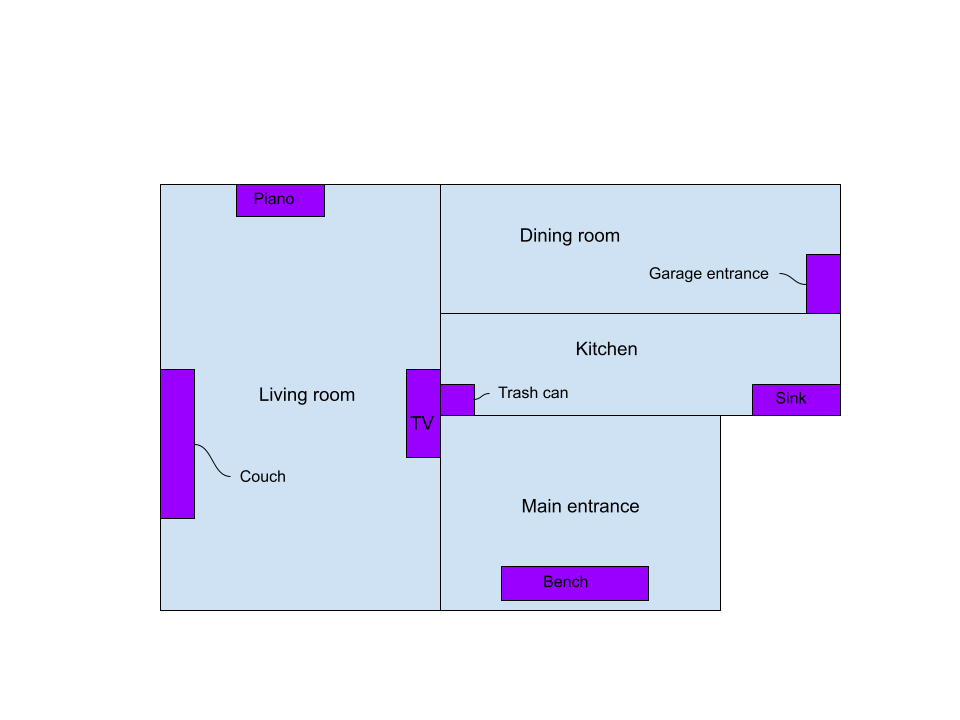
I placed my laptop in various locations to collect 2 minutes worth of RSSI data using the airodump-ng utility. Some Python, Pandas, and Matplotlib scripting later, I was able to produce some pretty diagrams relating locations, my network’s signal strength, and my neighbor’s signal strength!
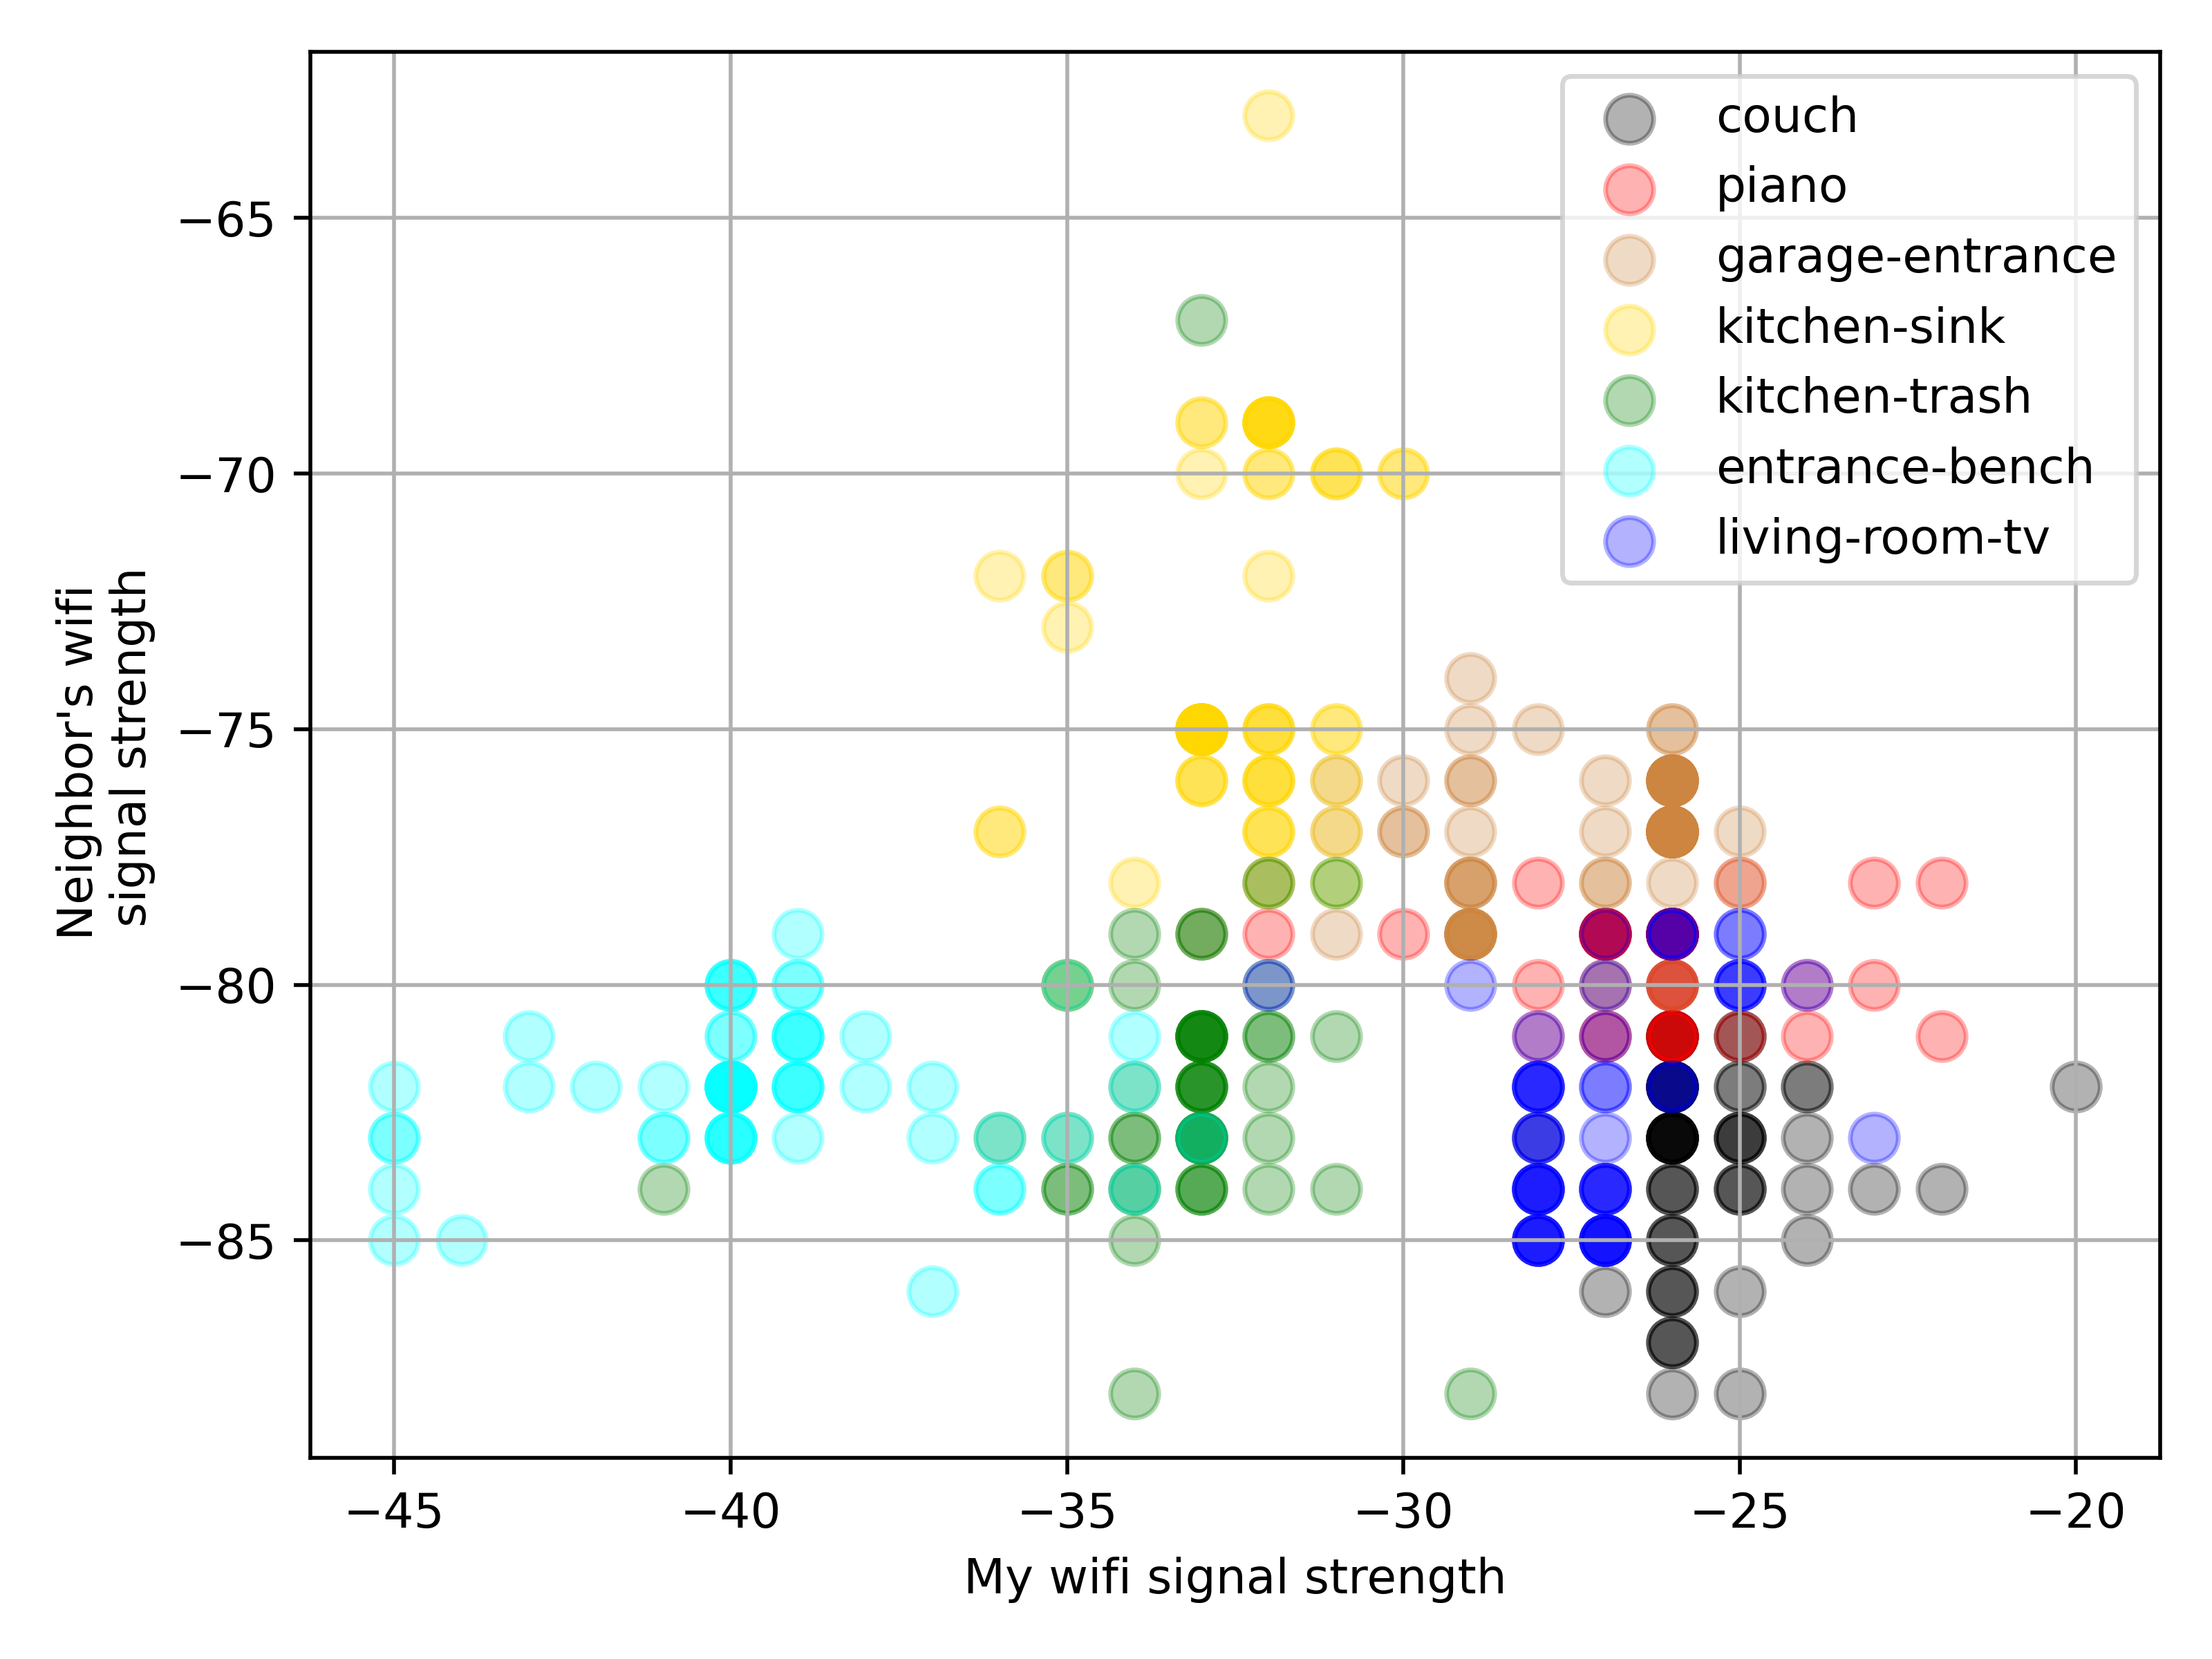
Tada! While my laptop could detect about 10 networks, I am only showing data for two of them for the sake of visualization. The x-axis displays my network’s RSSI’s, and on the y-axis shows my neighbor’s network’s RSSI’s. We would hope to see that each color cluster is clearly separate from the clusters. In fact, the light blue (entrance), bench (garage entrance), and yellow (kitchen sink) areas do seem to be fairly distinct. It’s reasonable to conclude that there exists a machine learning algorithm to differentiate between these locations.
Unfortunately, the same cannot be said for all of the measured locations. For example, the red area (piano) and the dark blue area (living room TV) have significant overlap, and I would need data from more networks to distinguish between them.
It’s worth noting the discrete nature of the data, rather than the continuous variation one would expect from a physical phenomenon. This is an artifact from the airodump-ng logging utility to the nearest integer.
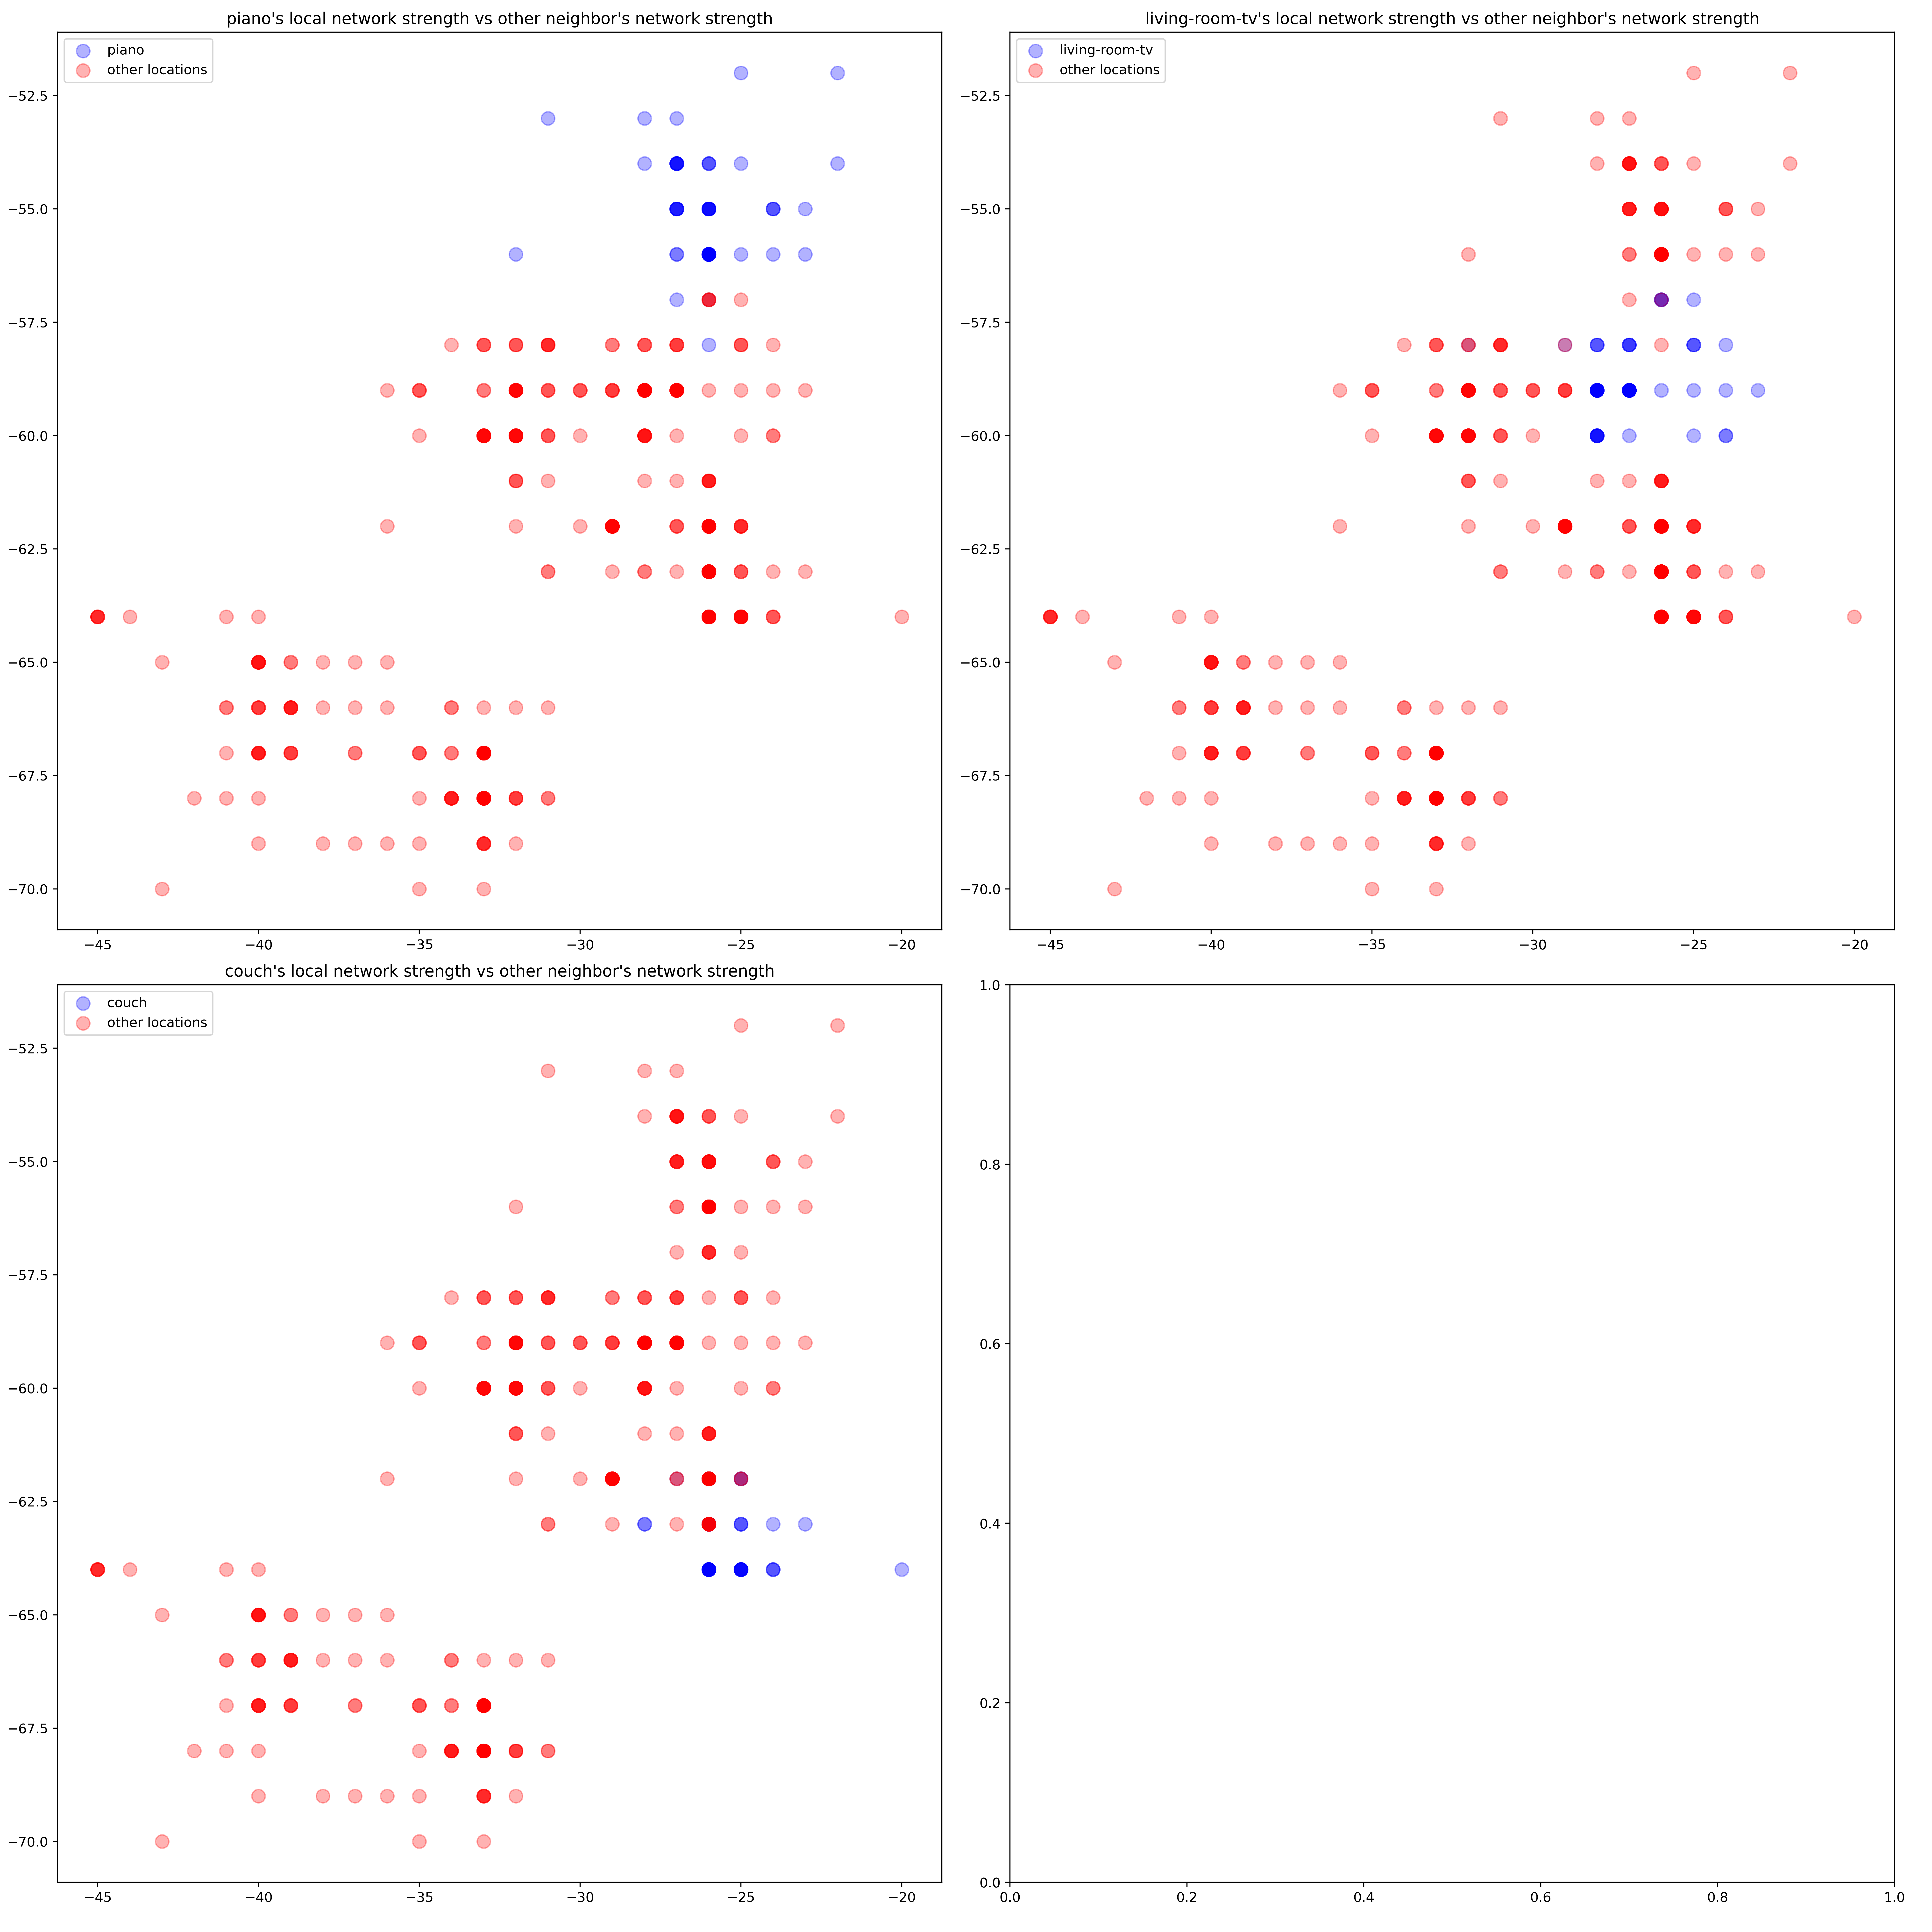
The cluster separation, or the lack thereof, might be hard to see with so many colors at once, so I’ve created seven graphs, each highlighting one location at a time
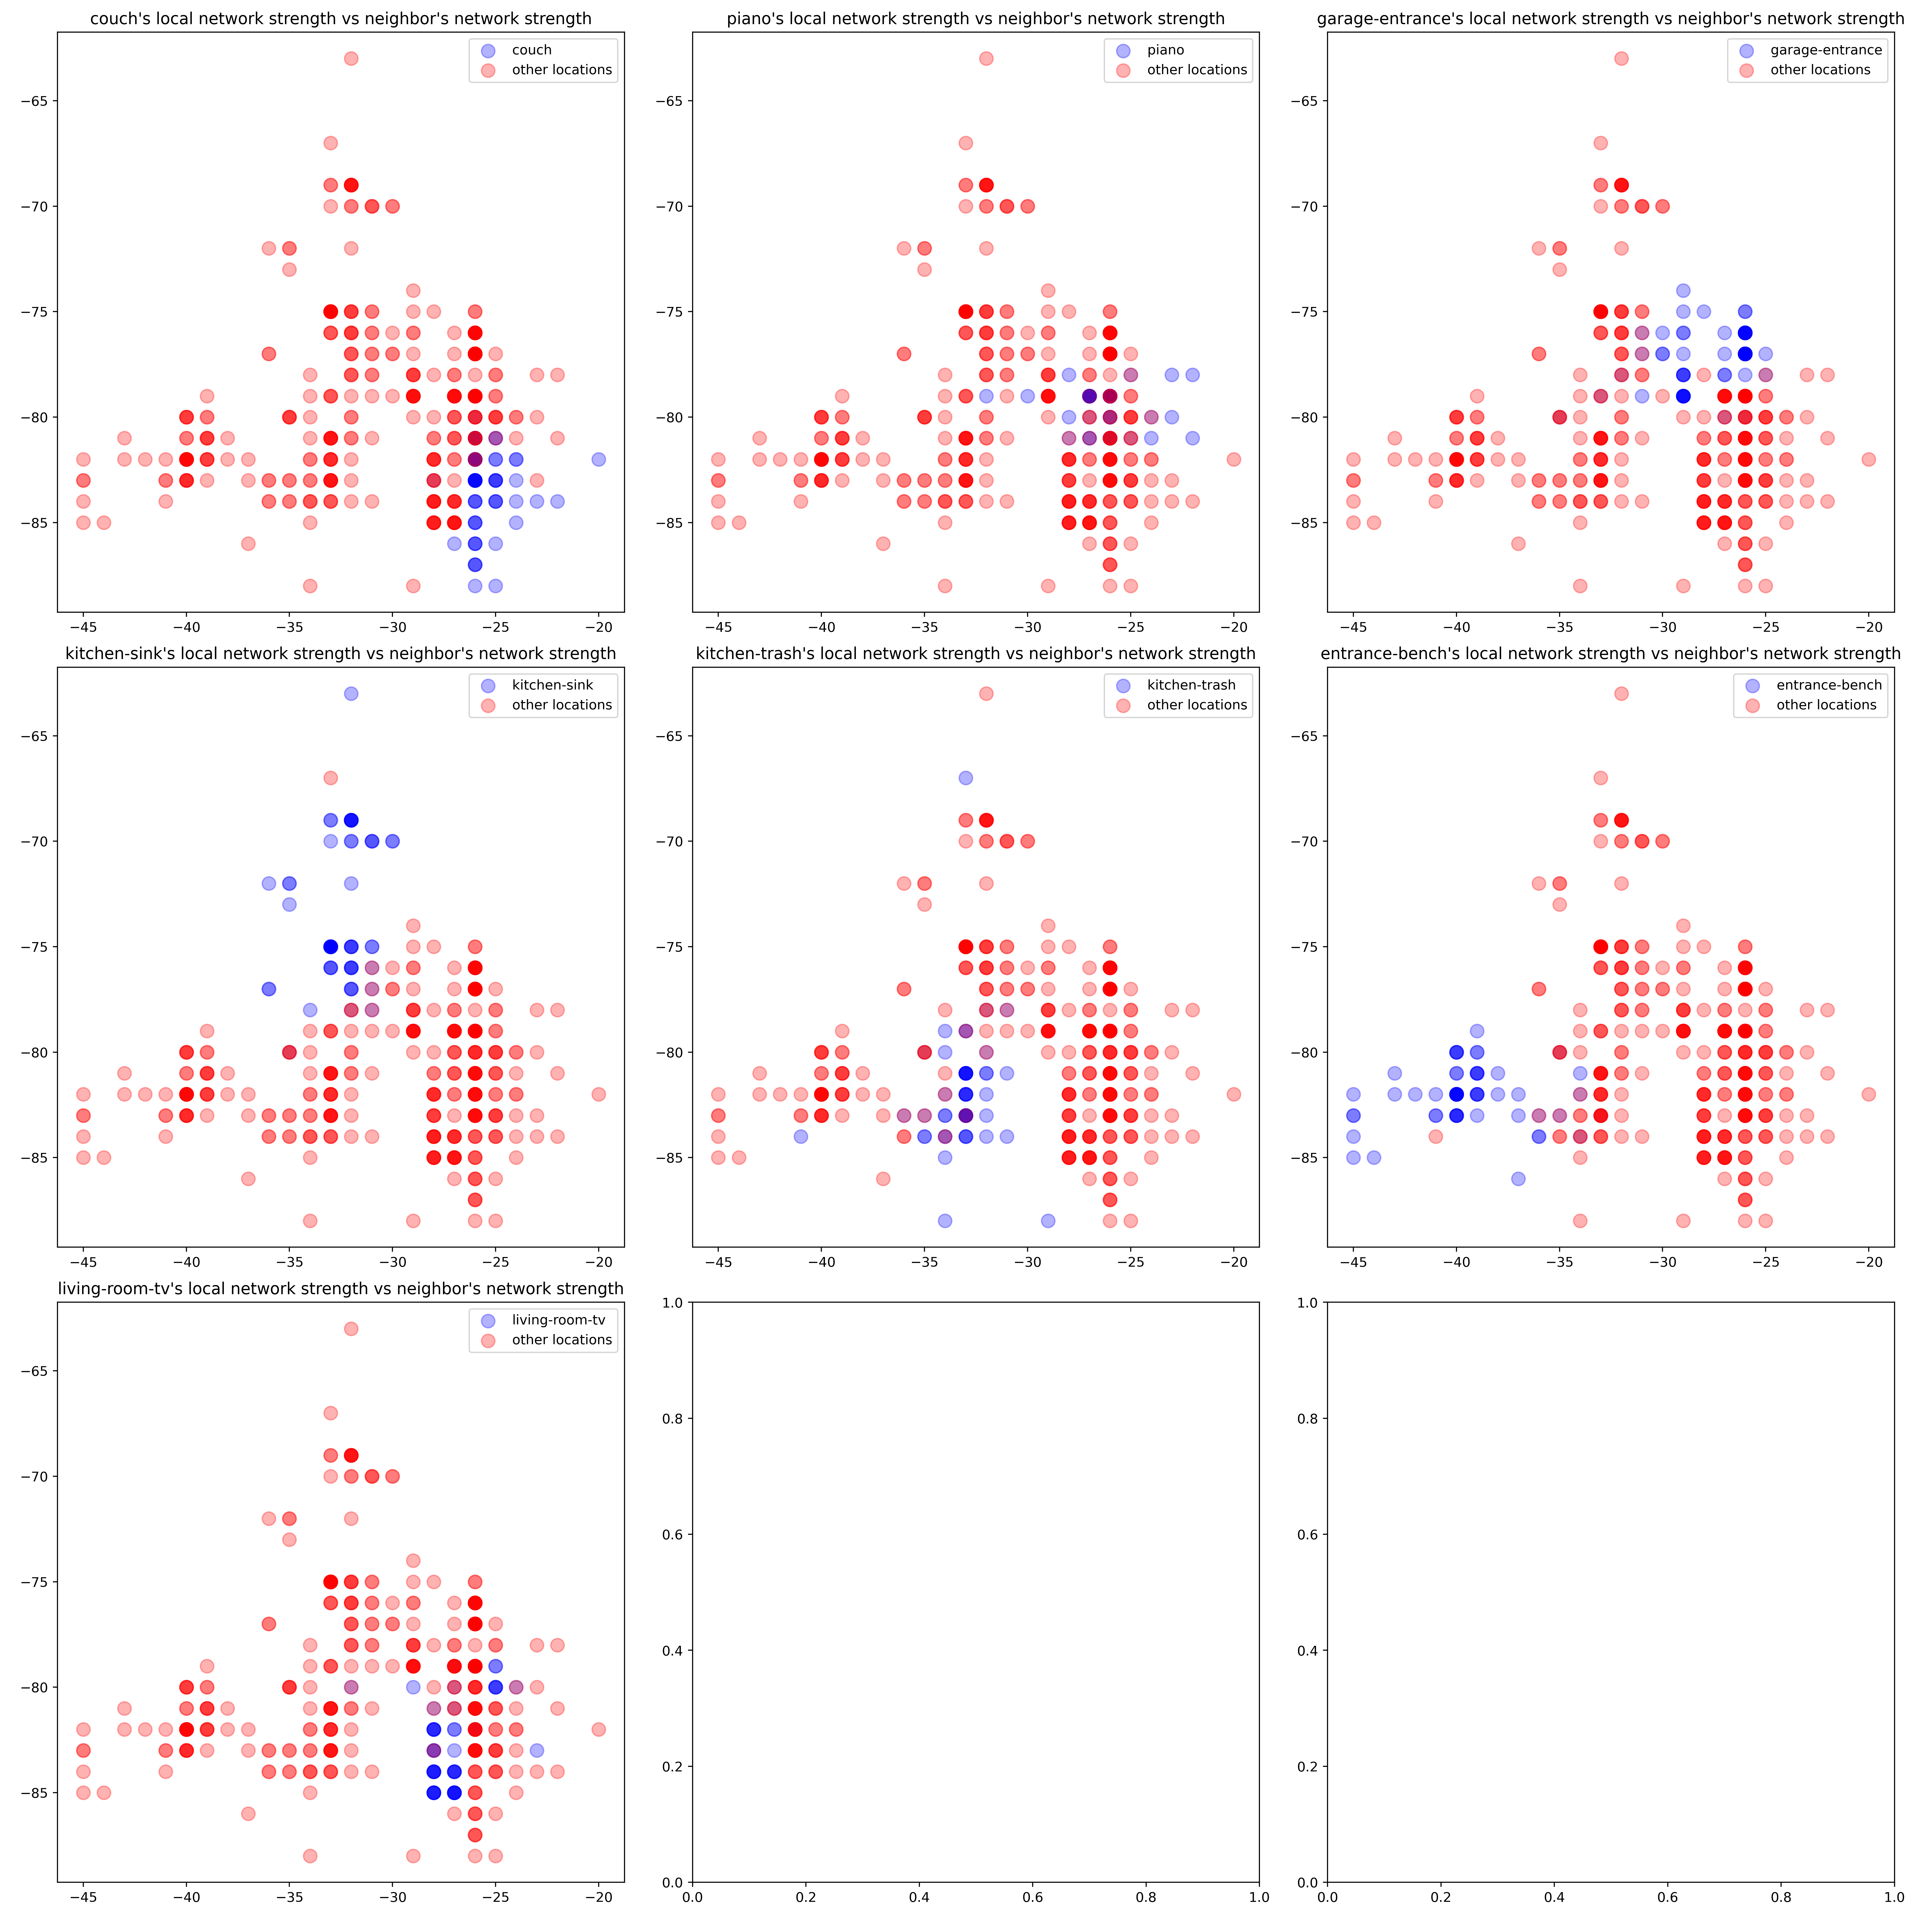 Note how the couch, garage entrance, kitchen sink, and entrance have a fair bit of separation. These locations are about 10 feet away from each other, so it’s promising that with just 2 networks, we can differentiate between locations that are about 10 feet away from each other.
Hopefully, information about other networks will be sufficient to identify the other areas.
The following graphs are made with data about my local network and a different neighbor’s network:
 Thankfully, we do get a fair amount of separation in those areas when we include this new network! Thus, with 3 networks, there is enough data to classify 7 areas of my house approximately 5 feet apart.
A keen observer might note that there seem to be fewer data points than in my initial plots! Why would this happen despite measuring every network for the same amount of time in every location? The answer is network stability. Routers that are further away and have weaker RSSI’s are not consistently detectable. In this case, my laptop could read data about my distant neighbor’s network approximately every 3 seconds. In contrast, I could detect and record data from my closer neighbor’s network as frequently as airodump-ng allows (every 1 second).
Conclusion and future work
The primary concern when creating an air-tag alternative is finding the appropriate data source to calculate location. After comparing several different options and collecting some data around my house, I was able to verify that Wi-Fi network strength contains sufficient information for localization with accuracy within several feet.
There are several more steps to translate this into a fully functional air-tag alternative. First, I have to train and test a machine learning algorithm to make estimates with this data. In my next post, I’ll compare how well support vector machines, neural networks, and simple Gaussian distributions compare for this application.
However, this algorithm would only classify several discrete locations. This makes sense because it’s easy to label training data this way. All I have to do is set my laptop down, write down the location, and wait for a couple minute’s worth of data. Unfortunately, PearTags won’t always be in one of several, very specific locations. I am not going to always forget my keys on the left couch cushion where I collected training data. If I leave my keychain sporting a PearTag on the living room table, I’ll want a more accurate estimate than “near the couch.”
Thus, the next step will involve a second algorithm to interpolate a more precise location from the first algorithm’s classification. Existing methods such as the Horus fingerprinting algorithm use weighted averages for this interpolation. For example, if the classifier says there’s 50% chance a fingerprint came from the couch, and 50% chance it came from the TV, the Horus algorithm would estimate that the location is midway between the couch and the TV.
I hope that using more sophisticated methods will yield better results. For example, an appropriately trained neural network might have a hidden layer that can detect a wall between the couch and the kitchen sink, and then use this information to come up with a more accurate location estimate.